In my last post I cooked a small K8s based Spring boot application that used distributed caching. I have adapted the application to create a basic (micro?)service setup where service A calls service B. To make sense of things I needed to see traces and logs for different cache hits and misses. I decided to try out Elastic stack locally since that is also what I use at work (albeit an older version). There are many ways to get this kind of setup to work locally (Docker compose, helm etc), but I decided to cook my own recipe based on ECK samples. I chose ECK since I wanted some thing that is supported and maintained for K8s. I also wanted to make it easy and repeatable for Windows platform since that is what I happen to use at work. While my example stack can be adapted to use with any framework, I will give test it with the Spring boot based caching demo ( and perhaps later I can also add a fronted as well for RUM).
Setup
The setup of this local stack is simple, even if the diagram below makes you think it is not. Basically the elastic stack is managed by ECK operator (think of it like a software that you tell what kind of setup you want and it makes sure that it is running on your k8 cluster, kind of like a human operator). We host the ECK operator in one namespace called elastic-system, the elastic stack in a name space called devoops and the application being monitored in the default namespace.
All namespaces can communicate with each other and if there is a service it can be reached via
service-name.namespace-name.svc.cluster.local:PORT
Each application is behind a kubernetes service and you should be able to access it via the above URL.
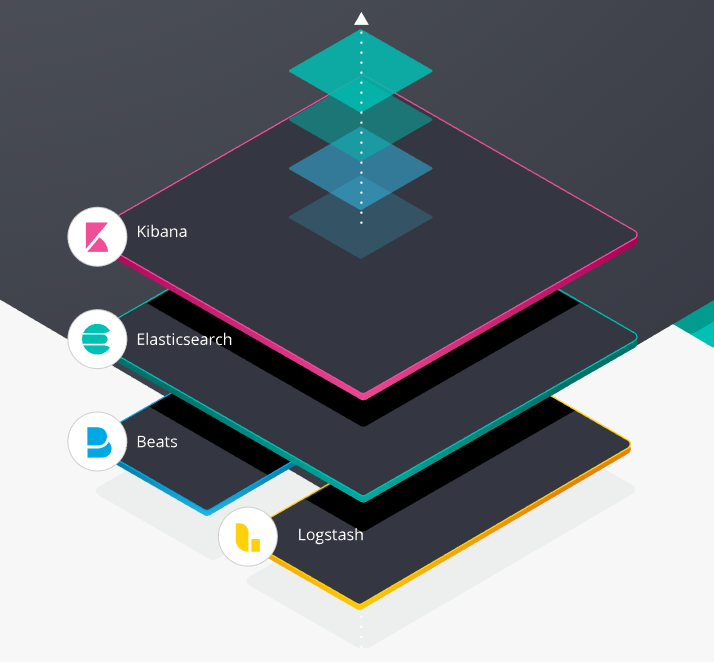
The elastic stack has four installed components.
- Elasticsearch: where all the data gets stored.
- APM server: It manages application performance data collection.
- Kibana: The UI for querying collected data (and managing the stack it self)
- Filebeat: The agent that pushes log files
There is also an embedded library inside the applications that help PUSH the performance data to APM. I am not using Logstash
You can follow the steps I took to start this stack.

Walk through
Let's walk through some of the code.
At 1 you can see that I am enabling elastic trial license. While this is not necessary for basic features of Kibana and APM. I find it useful to test locally using things like service map. As I also mention in the rep this sample uses Elastic enterprise features using ECK license management features. Please check the EULA for the 30 day trial this software is distributed under.
On 2 you find that while all the ECK stuff is created in the elastic-system namespace, I chose to create the elastic stack it self in the devoops namespace. This should make things easier to manage.
On 3 I add default username and password for kibana. This makes things easy, but also make the setup insecure and not ready for production. If removed this while section , ECK will generate default password for you. In general that is the pattern that I am using, I create things that I want to have that are different from what ECK would generate, before I bootstrap using ECK.
Filebeat
Let's take a look at file-beat configuration (especially the things that I have added)
At 1 you see a strange reference to some thing that looks like elasticsearch. This should be read as elastic search development and it will come further down in the yaml file.
At 2 we setup the base path of kibana that we intend to connect to as /kibana (this we will setup on the kibana server as well and as a reference in the ingress controller and the APM setup).
At 3 we disable SSL (to make it easier for local deployment, otherwise ECK would setup self signed certificates)
At 4 we specify which events should be dropped (I am only interested in my application logs and data, so I drop every thing from namespaces that I consider infrastructure)
At 5 we specify how file beat needs to run as a deamonset (i.e at least one on each node). I am reusing the autodiscover example from ECK. I don't intend to go in deeper walk through of this code, but in summary the ECK operator will ensure that a filebeat pod runs on our test node and it discovers relevant pods and ships logs to elastic search.
Kibana
For brevity I will skip Elastic search setup as it is fairly straight forward. and go to Kibana instead.
At 1 we see that I put a base path for kibana. But that alone is not enough for it to work behind a reverse proxy (hence the rewrite setting).
At 2 we see that HTTP is disabled (again to make life easier) and at 3 I use a readiness probe on the right base path.
APM
The last portion that we will walk through is APM. It is very similar to other components. But here I hard code the APM token (1) and put the elastic stack password in clear text (2). It is definitely a good idea to use K8s secret in production.
Running the stack and the demo application
Now we heave gone through the code, let's run the stack. It is very simple
kubectl apply -f all-in-one.yaml
It will take some time but after a while you should be able to see pods running
kubectl get pods -n devoops
NAME READY STATUS RESTARTS AGE
apmdev-apm-server-5665445654-xxzwj 1/1 Running 0 14h
beatdev-beat-filebeat-8c4w9 1/1 Running 1 14h
esdev-es-default-0 1/1 Running 0 14h
kbdev-kb-8454c66d9-47xh2 1/1 Running 0 14h
If all is fine, then you can browse to http://kubernetes.docker.internal/kibana and user the default credentials (elastic/elastic)
You can browse to APM and see if you can see service map (an X-pack feature)
I updated my spring boot caching demo sample to use elastic stack.I used ecs-encoder to log in json format.
In 1 you can see how I use hints based autodiscvoery to ingest logs in json. I also use environment variables in 2 to help setup APM.
If you run the demo application you should be able to see logs for both apps

And if you also poke the application on an endpoint like
curl -H "Accept: application/json" -H "Content-Type: application/json" http://kubernetes.docker.internal/remotecustomer/2
You should be able to see the APM trace and service map.

Final Thoughts
I hope you find this guide useful. Please reach out to be on twitter or comment here on the blog if you have any suggestions or notice some thing wrong. I plan to create a video walk through of this setup in the future as there are so many things to show and it's not easy to write about them with just screenshots.
If you want to learn more about Elastic stack, check out this list of resources that I shared a while ago.
Comments